Infor EPM – MS Excel Plugin
My Role
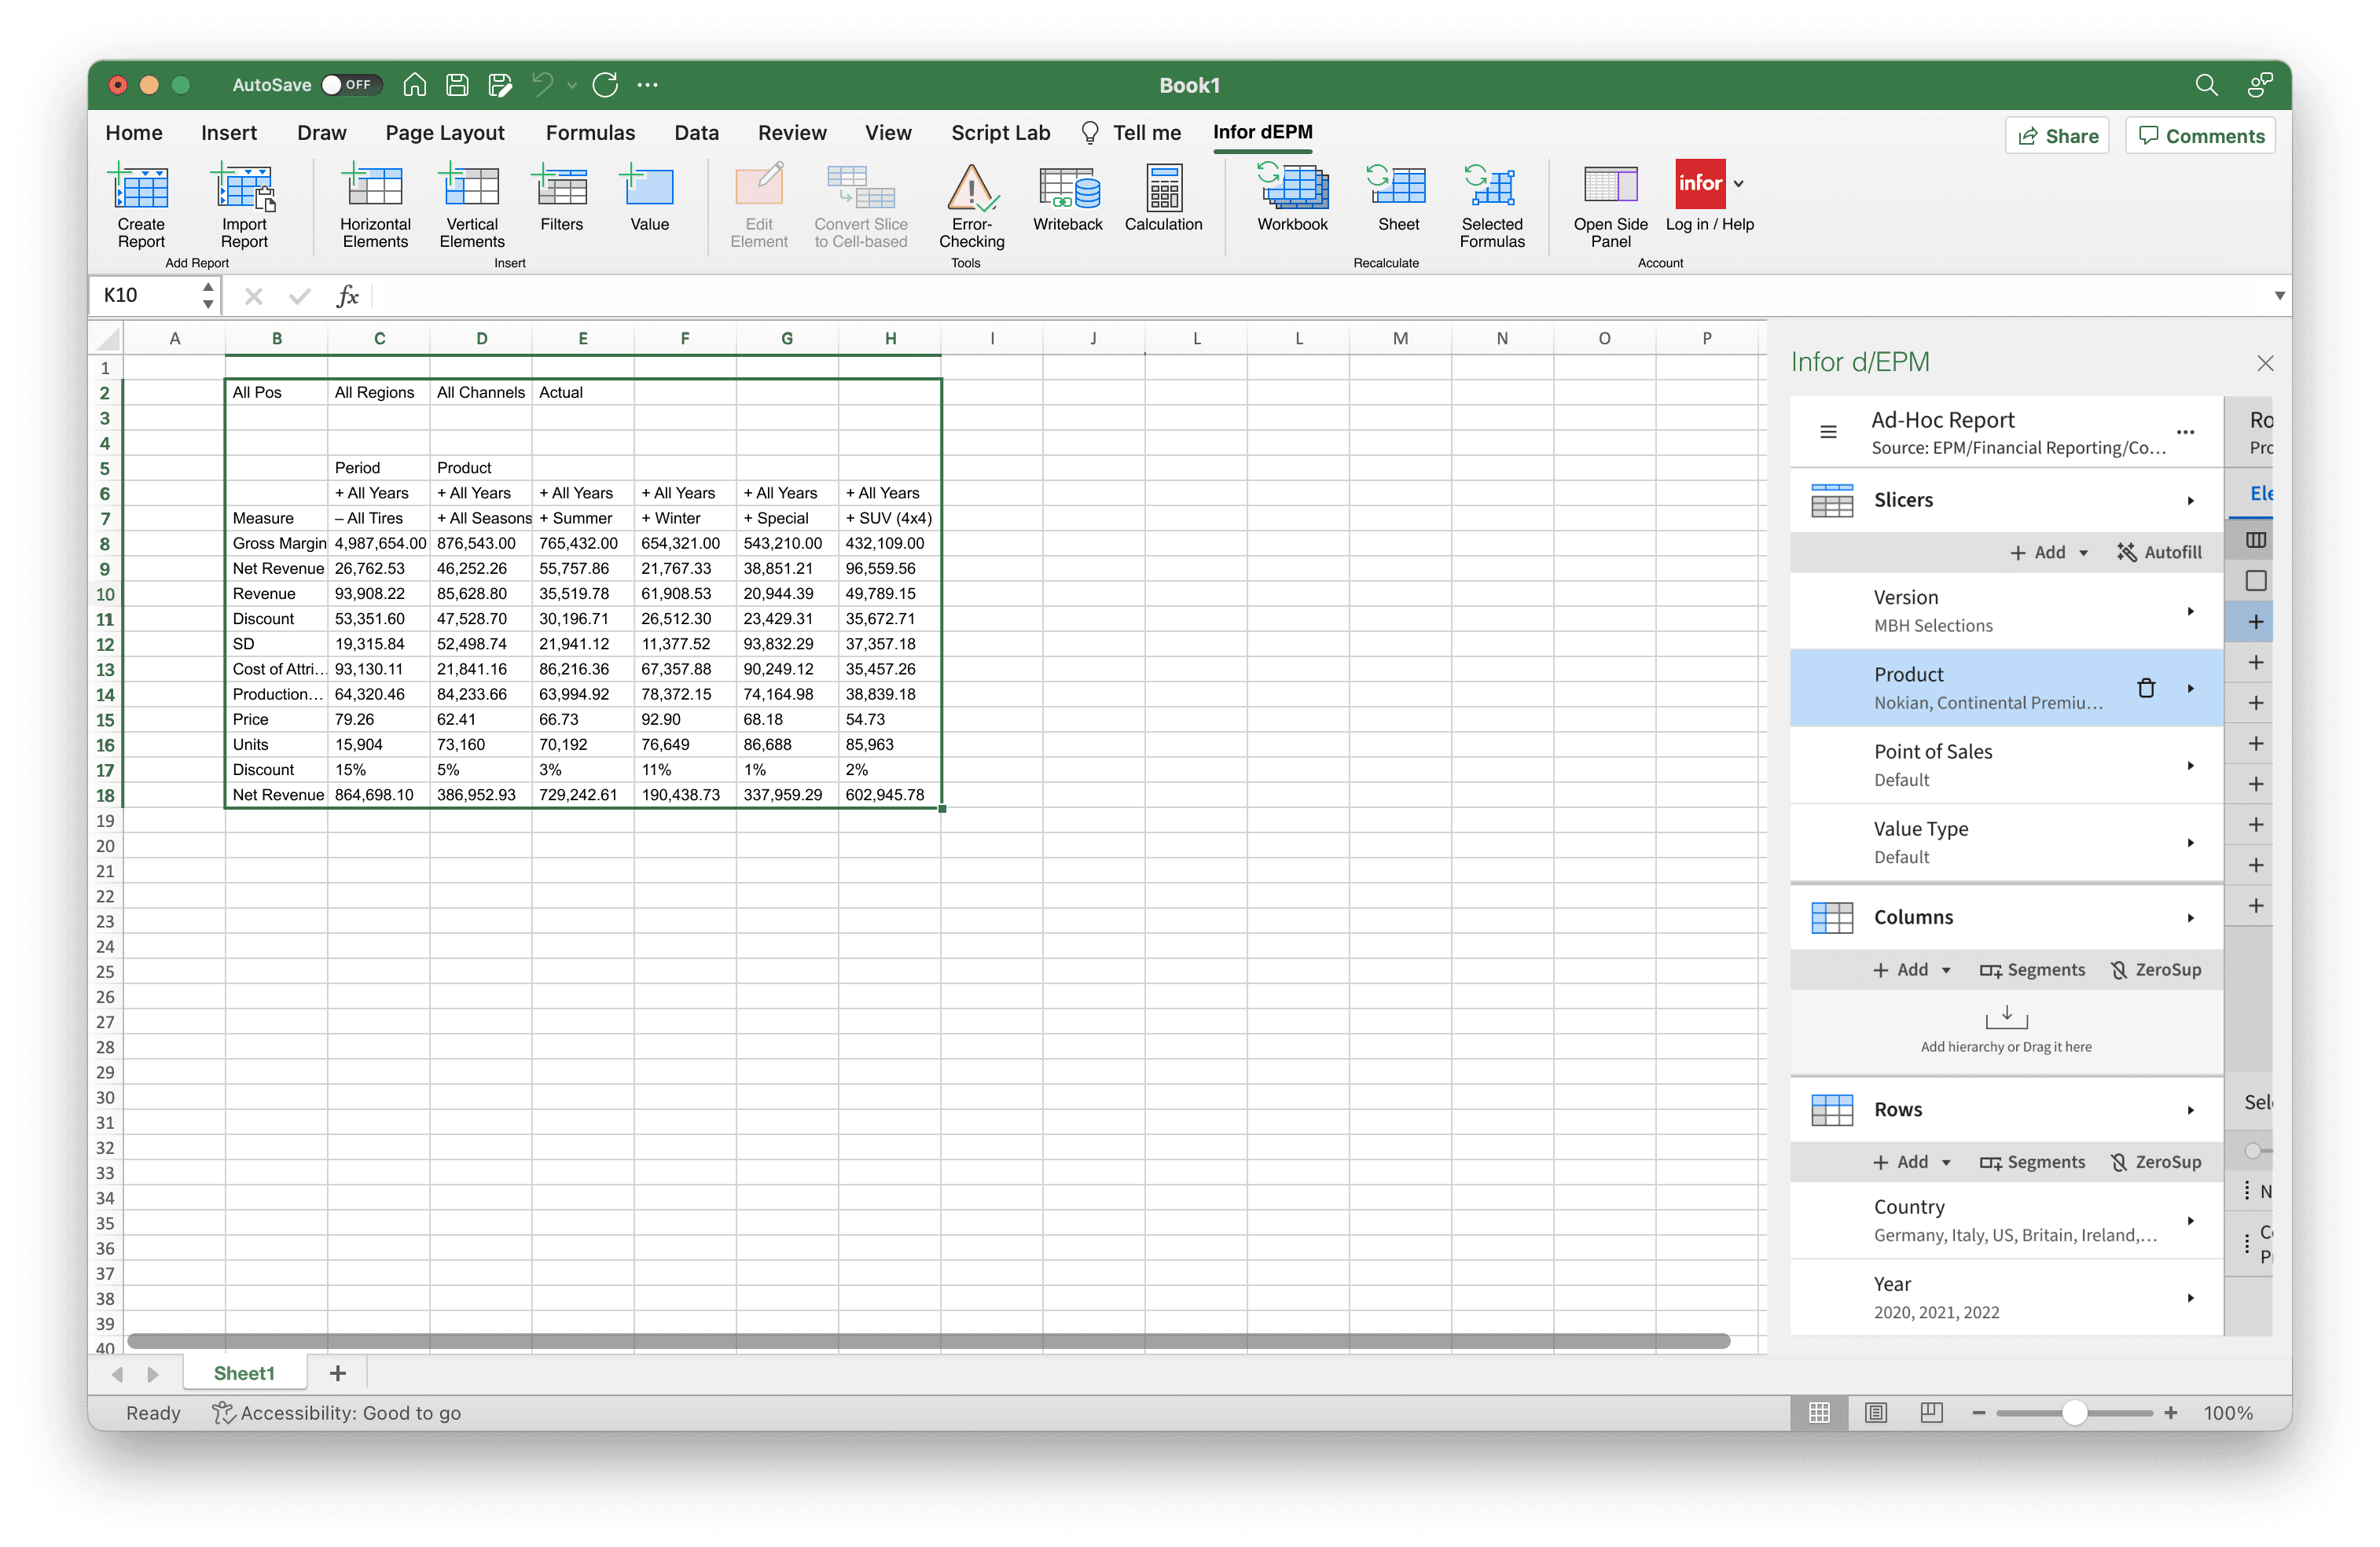
I designed an enterprise Microsoft Excel plugin that allowed finance teams to work with complex OLAP databases directly inside Excel.
The plugin helped users browse multidimensional data, build reports, explore hierarchies, write back values, and share insights without leaving their familiar spreadsheet workflow.
The biggest challenge was fitting a large amount of enterprise functionality into a very small Office side panel while keeping the experience understandable and scalable.
I led UX research, workflow design, information architecture, wireframing, and interaction design. Over time, the product evolved into a much larger analytical platform and later became the foundation for additional EPM products.
The Challenge
Finance and planning teams relied heavily on Excel for reporting, forecasting, and data analysis, but existing OLAP tools were often difficult to learn and disconnected from real spreadsheet workflows.
The goal was to bring powerful database functionality directly into Excel without overwhelming users with complexity.
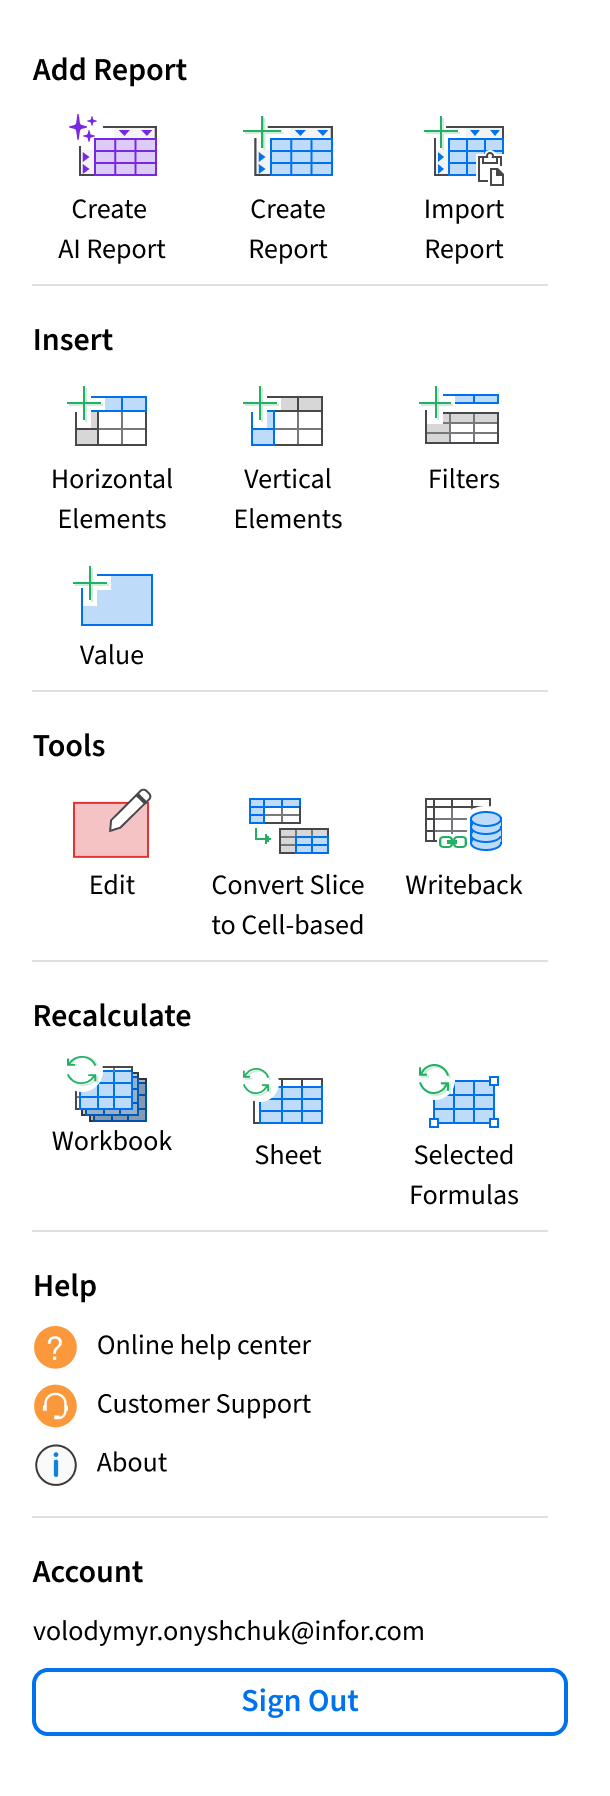
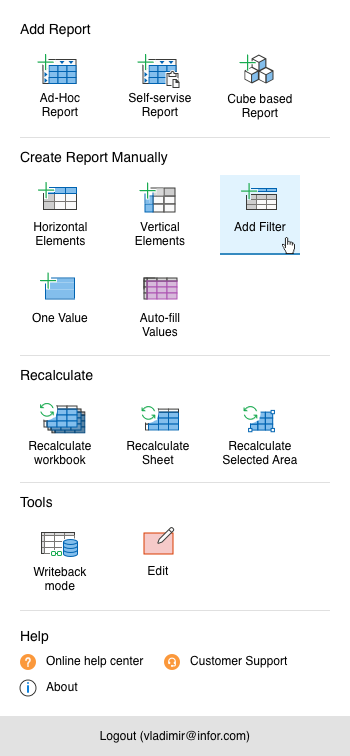
The plugin needed to support:
- browsing large multidimensional datasets
- navigating hierarchies
- creating reports
- filtering and sorting data
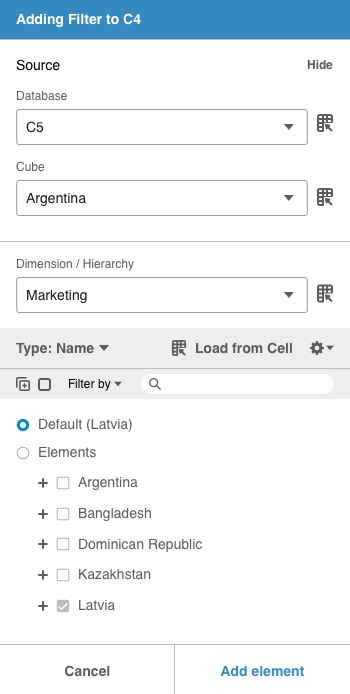
- writeback operations
- advanced analytical workflows
All of this had to fit into a narrow Office side panel.
One of the biggest UX challenges was balancing power with clarity. The interface could not be overly simplified because accountants and analysts depended on advanced functionality every day. At the same time, the experience had to stay easy to scan and predictable even as new features were added over the years.
Another important challenge was scalability. The architecture needed enough flexibility to support future growth without turning the product into a confusing collection of disconnected features.
Research & Discovery
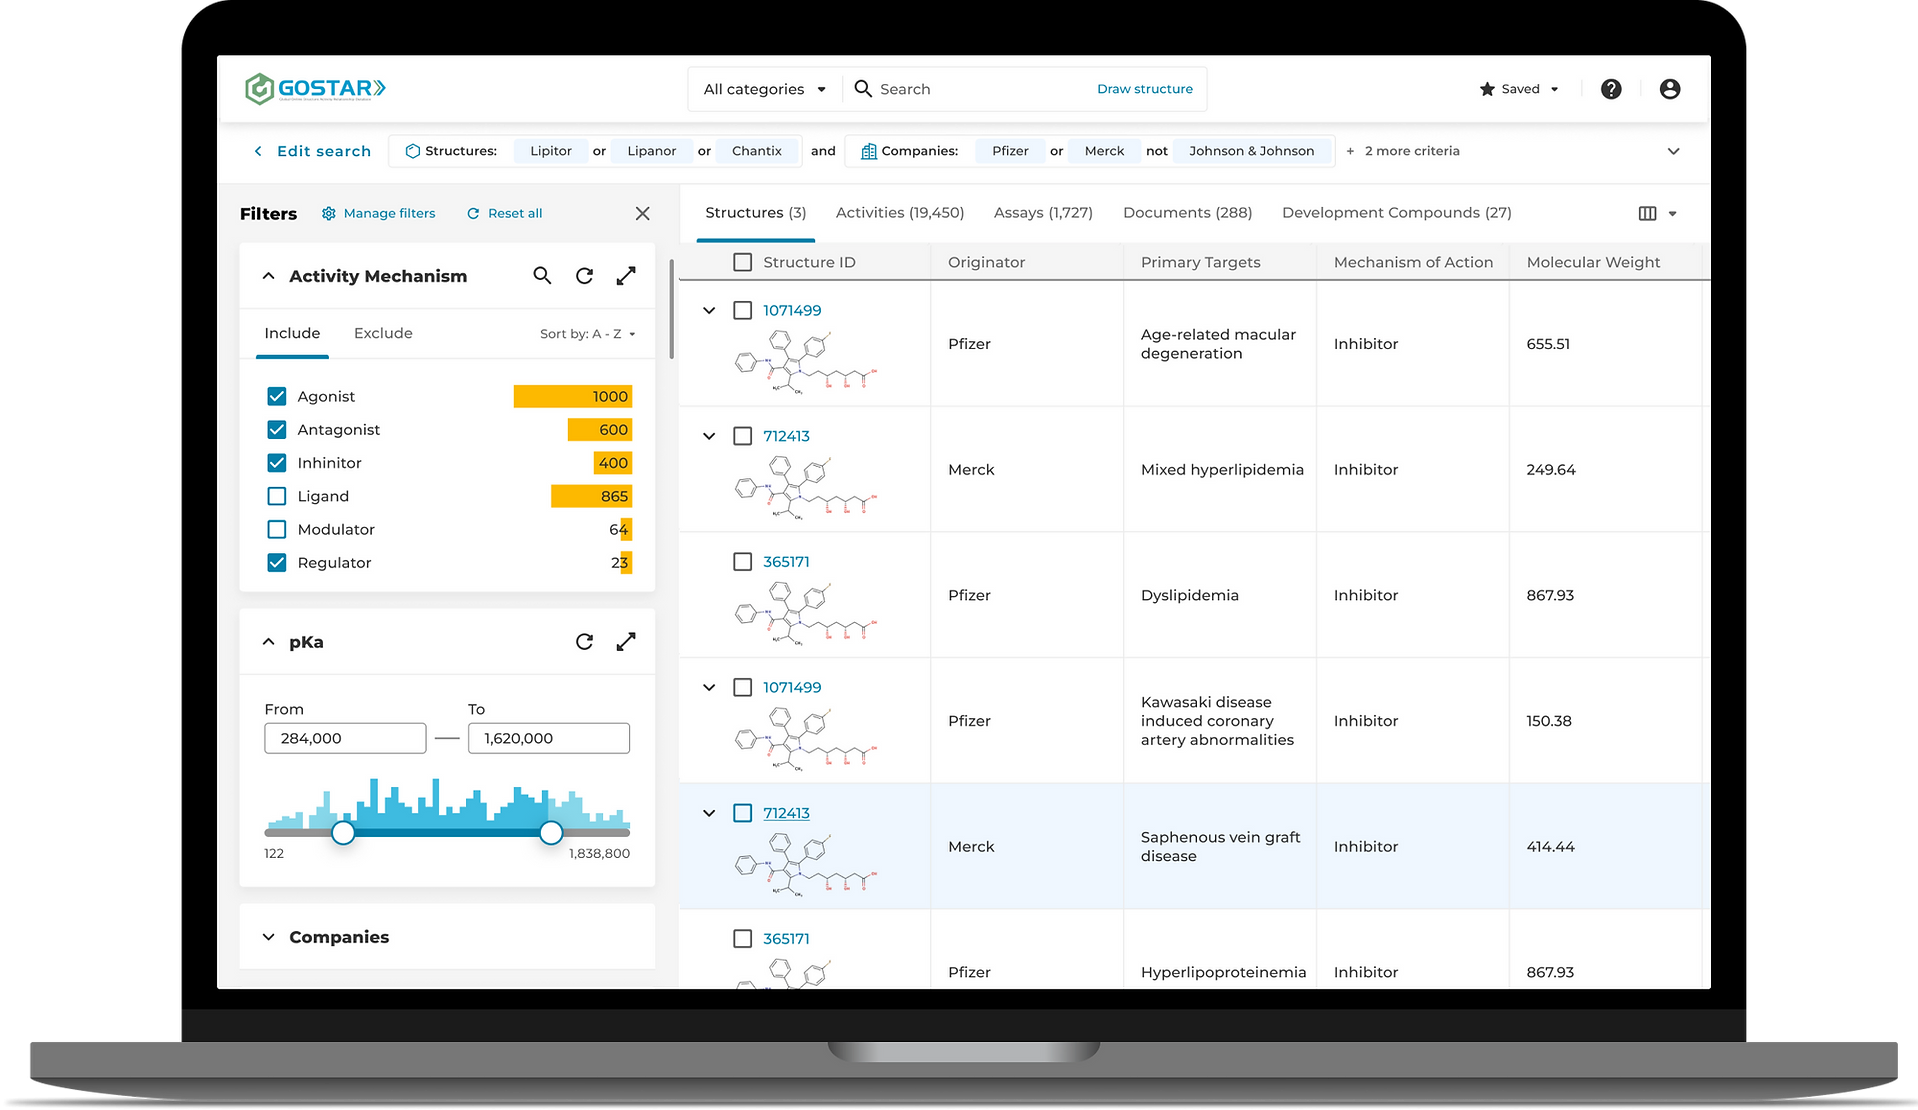
I started by researching existing OLAP and financial reporting tools to understand common workflows, interaction patterns, and usability problems.
I also worked closely with stakeholders, business analysts, and internal budgeting teams to identify the most important workflows and prioritize functionality.
The early design work focused heavily on information architecture and workflow structure rather than visual polish. I created wireframe prototypes to validate whether users could efficiently navigate large datasets and complete reporting tasks without becoming overwhelmed.
A major design goal was making the plugin feel like a natural extension of Excel instead of a separate enterprise application. Since users already spent most of their time inside spreadsheets, preserving familiar mental models helped reduce friction and improve adoption.
The interface relied on:
- clear information hierarchy
- progressive disclosure
- scalable navigation patterns
- contextual actions
- reusable interaction structures
This approach helped keep the interface manageable despite the density of enterprise functionality.
Evolution Over Years
The plugin continued evolving for more than six years as customer workflows became more advanced and new enterprise requirements appeared.
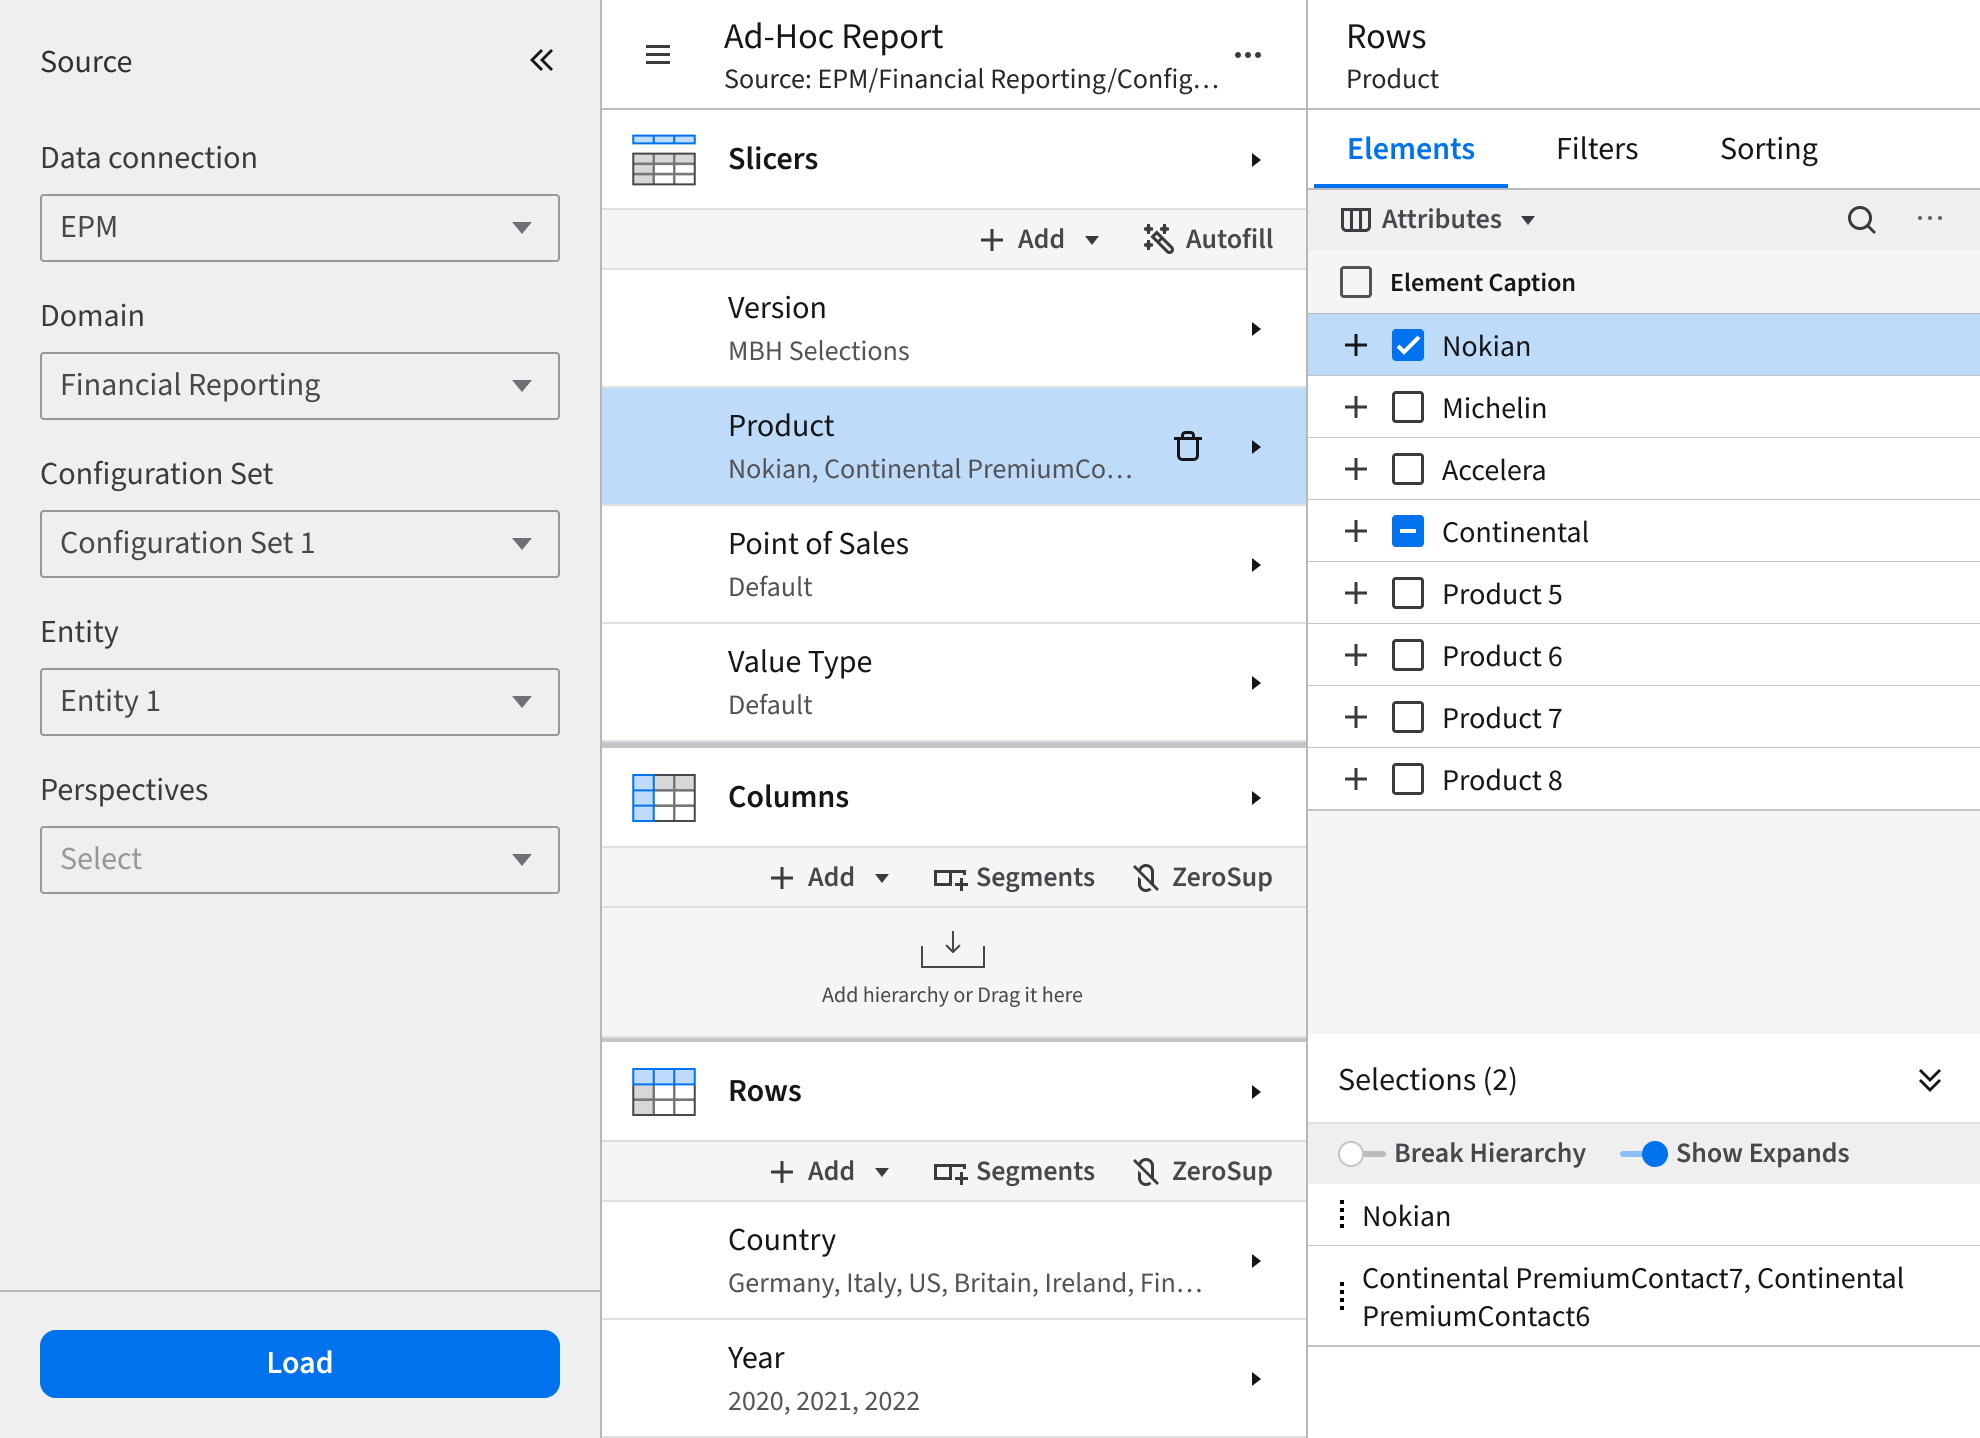
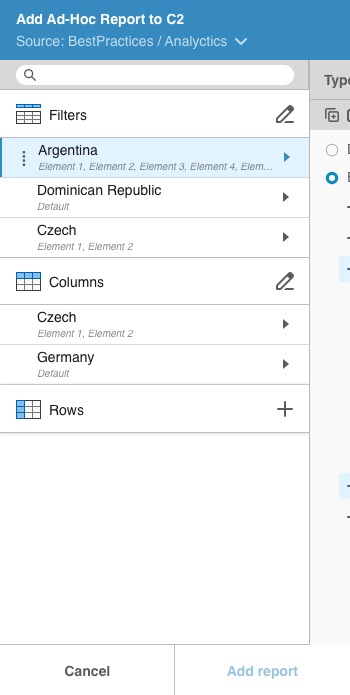
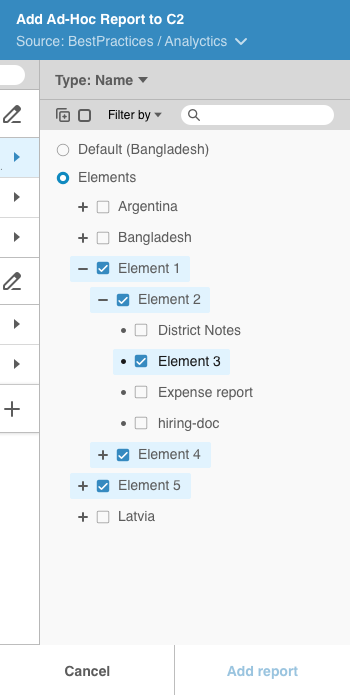
One of the larger improvements was a more advanced database browsing experience that made navigating complex OLAP structures faster and easier.
The reporting workflow also became more dynamic over time. Instead of manually selecting elements for rows and columns, users could later create rule-based selections, such as displaying all children of a parent node or all elements from a hierarchy level. This allowed reports to automatically adapt when database structures changed.
Another major addition was support for calculated elements, allowing users to define custom formulas directly inside reports.
Advanced filtering and sorting capabilities were also added both globally and at the axis level, giving users more control over large analytical datasets.
Despite the growing feature set, the original UX foundation remained stable and scalable throughout the product's evolution.
As AI-driven workflows started becoming more common, the product direction also evolved toward exploring AI-first interactions. The goal was not simply adding AI features, but rethinking how users could start analytical workflows through natural language and intelligent assistance while still maintaining transparency, flexibility, and full user control over complex reporting tasks.
Impact
The product was successfully adopted by enterprise clients working with large-scale financial data inside Excel.
User feedback consistently highlighted that the plugin made complex OLAP workflows easier to understand and more approachable for day-to-day reporting tasks.
One of the strongest outcomes was the longevity of the original UX architecture. The interaction model and structural decisions supported several years of feature growth without requiring major redesigns.
The product also influenced the broader Infor EPM ecosystem. Many interaction patterns and workflow concepts later became the foundation for additional products, including web-based AdHoc data discovery and reporting tools.