Infor EPM – AdHoc Reporting Tool
Overview
Infor EPM AdHoc is a web-based analytical reporting tool built on top of the successful Excel Plugin experience. The goal was to bring multidimensional data exploration into the browser while expanding reporting, visualization, and dashboard capabilities.
The product allowed finance teams and executives to browse large OLAP datasets, build reports, create visualizations, and share insights across the organization.
My primary focus was the design of the reporting experience, including the Advanced Grid, interactive data exploration workflows, chart integration, report styling, and overall information architecture.
Over time, the product became the foundation for several reporting and dashboard solutions within the Infor EPM ecosystem.
From Static Reports to Interactive Analysis
Before AdHoc, users primarily consumed data through highly customized reports created by administrators or power users.
While these reports answered specific business questions, users had very limited ability to explore the underlying data, adjust views, investigate anomalies, or build their own analyses.
The goal of AdHoc was to move beyond static reporting and give business users direct access to multidimensional data without requiring deep technical knowledge of OLAP systems.
The challenge was making millions of interconnected data points accessible without overwhelming users with complexity.
Reusing What Already Worked
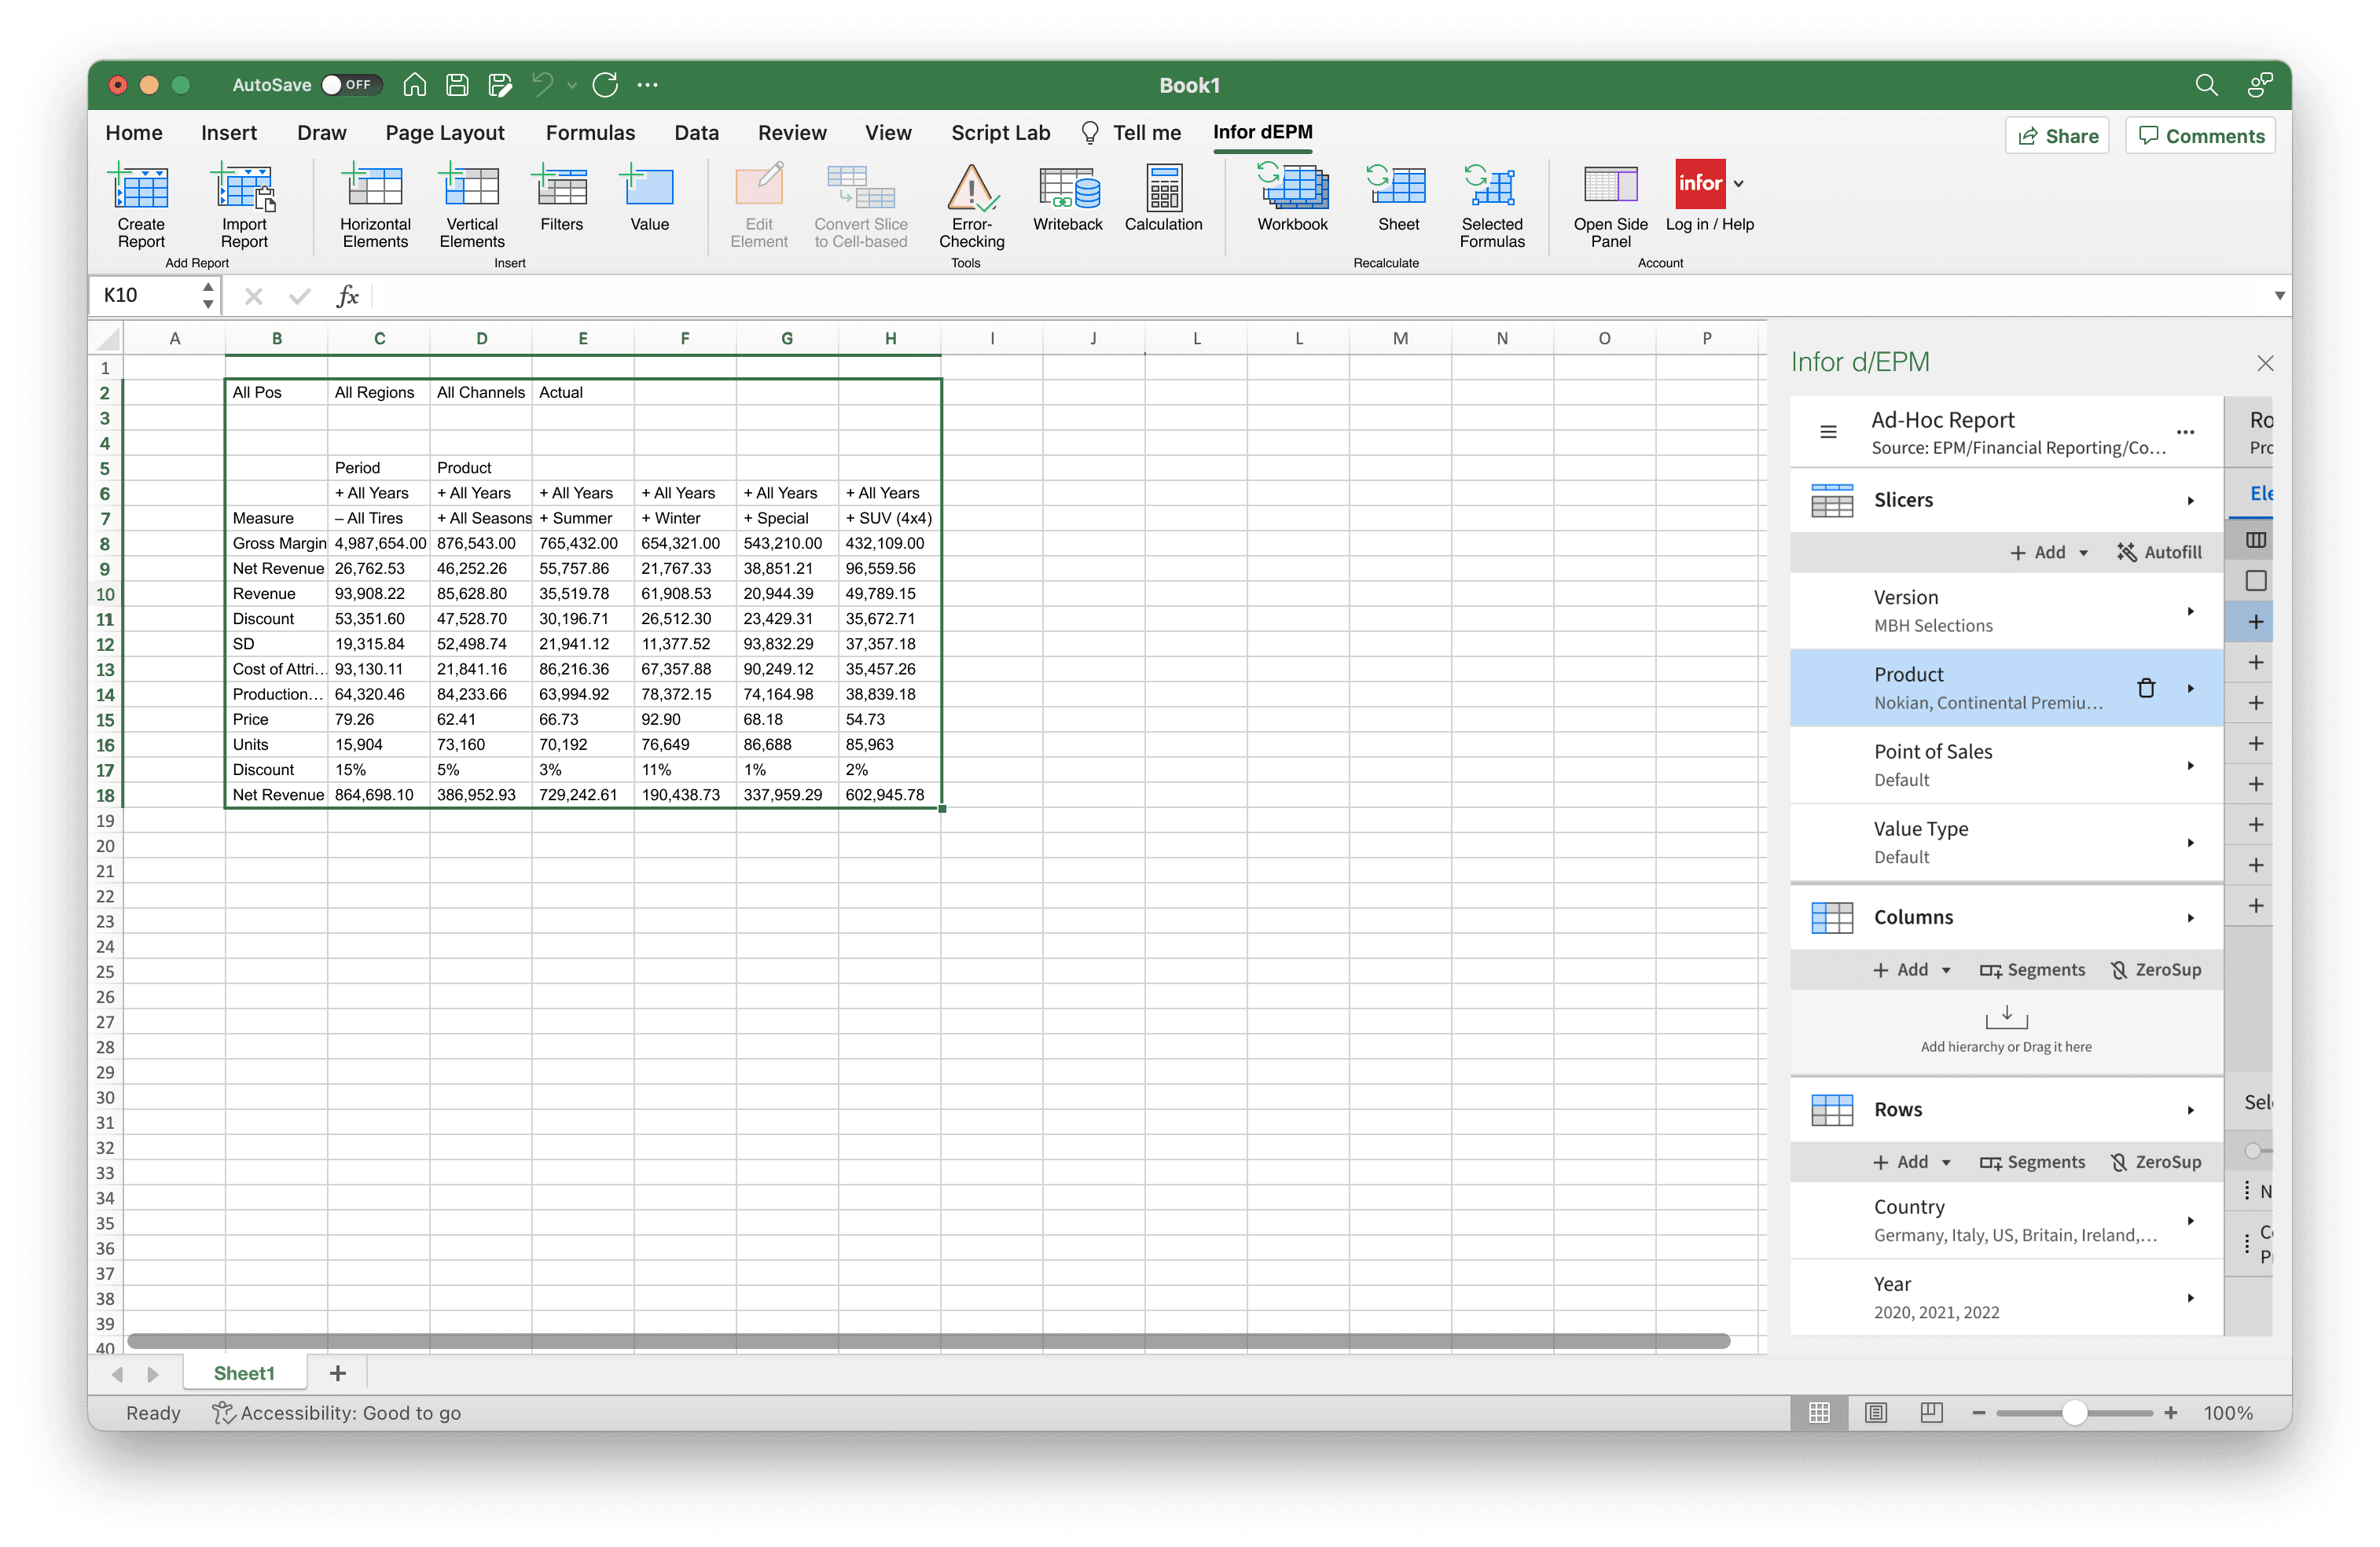
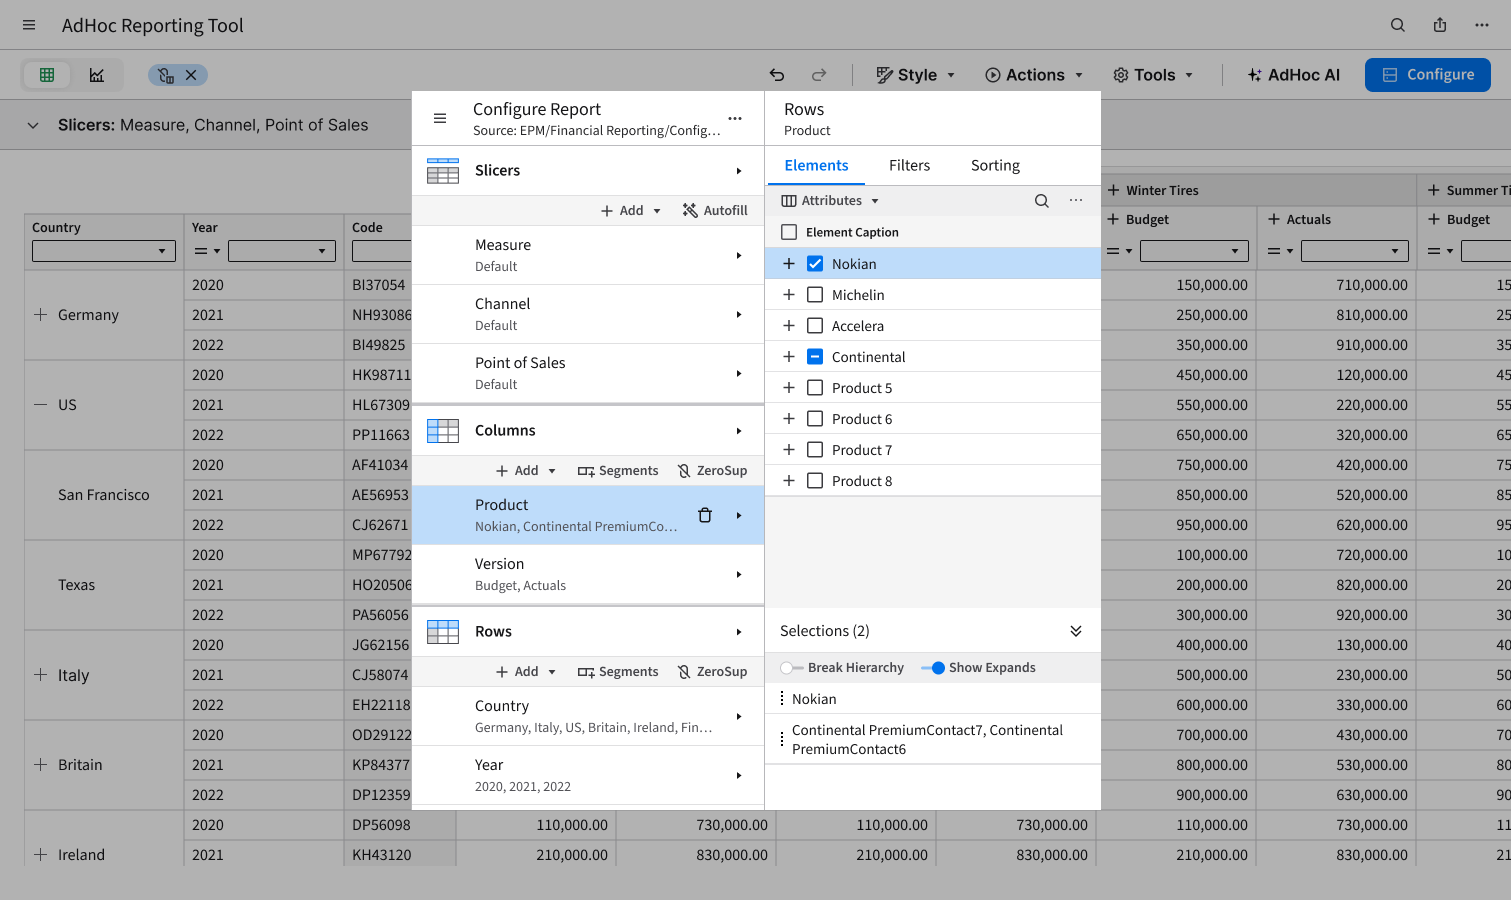
One of the most important product decisions was preserving the report configuration workflow from the Excel Plugin.
The web platform created opportunities to redesign the experience completely, but doing so would have increased development effort, delayed adoption, and forced existing users to relearn familiar workflows.
Instead, I intentionally reused the same configuration concepts and interaction patterns that users already understood from Excel.
This reduced the learning curve, accelerated adoption, and allowed users to move seamlessly between Excel and the web experience while benefiting from the additional capabilities the browser environment provided.
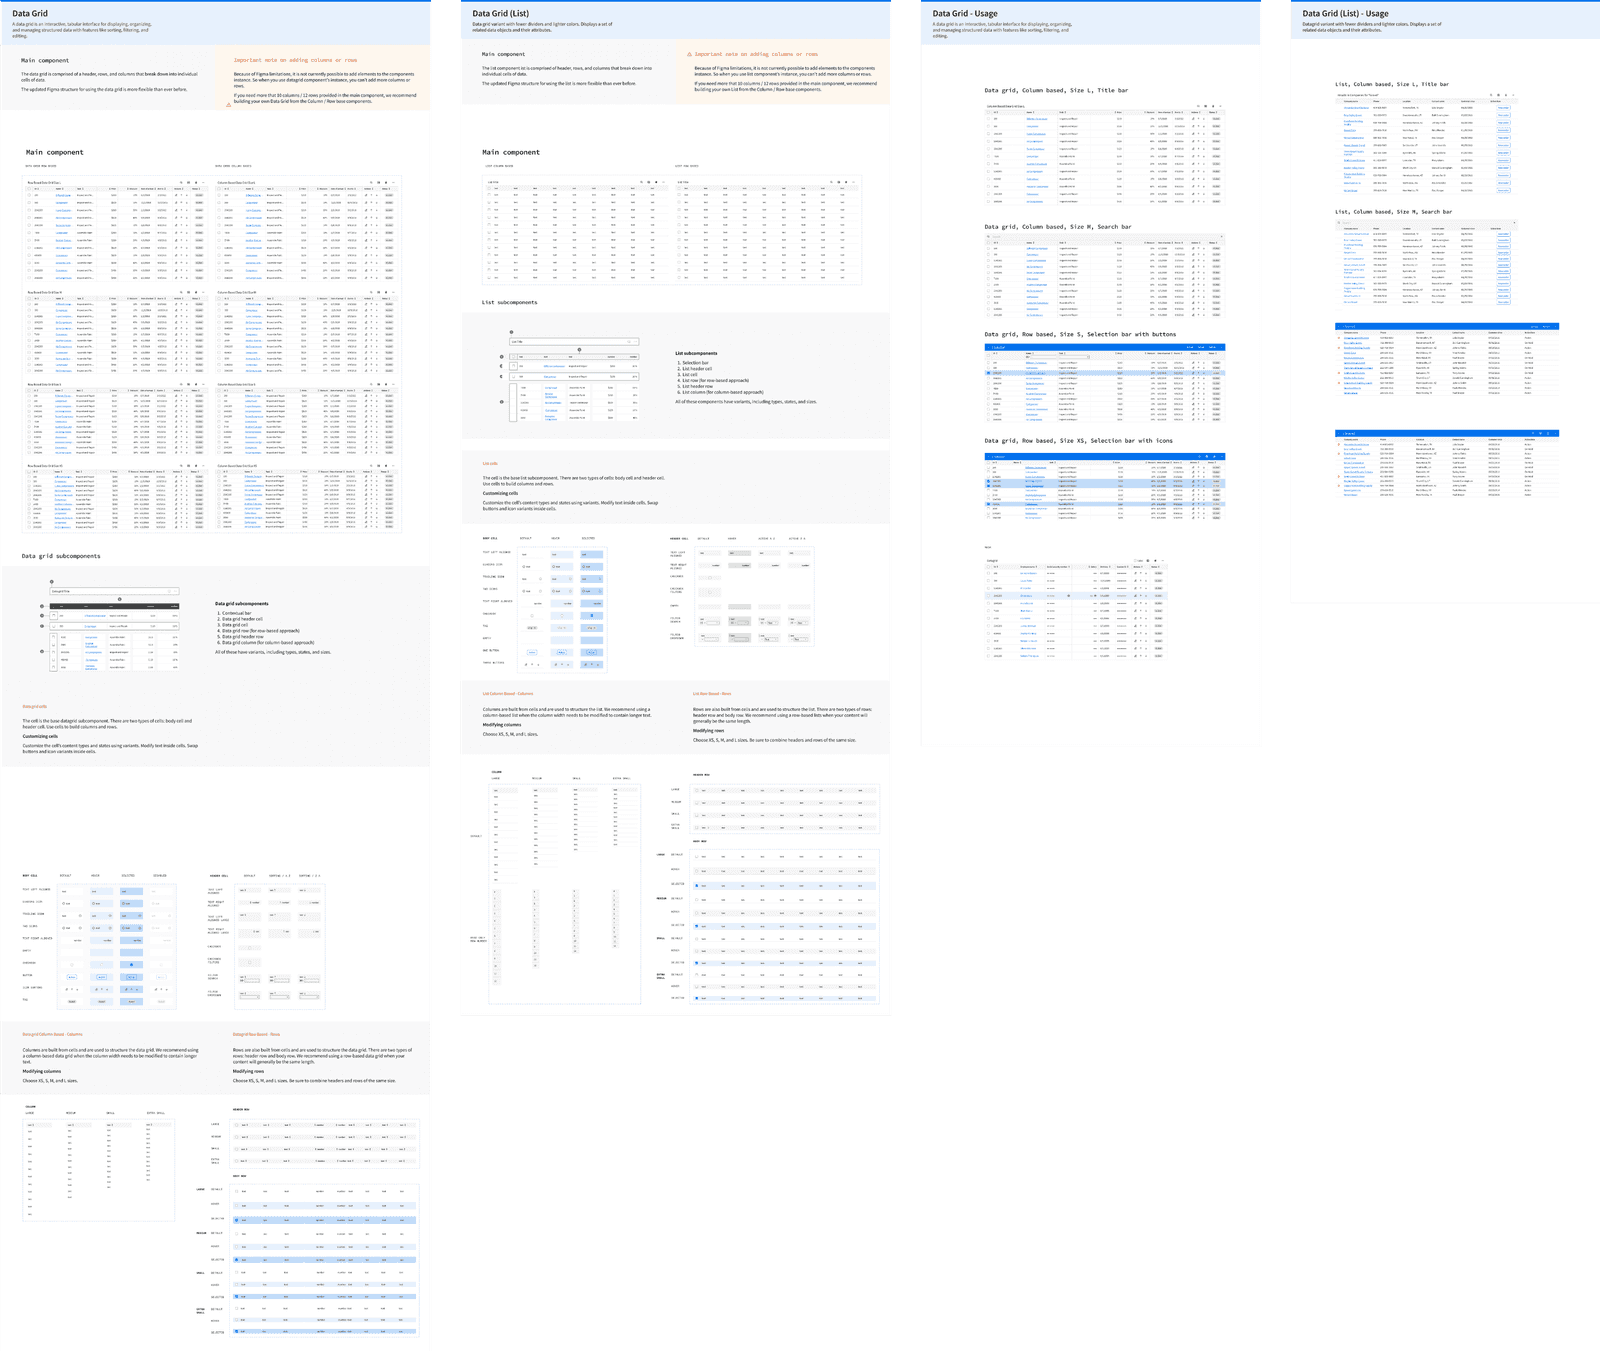
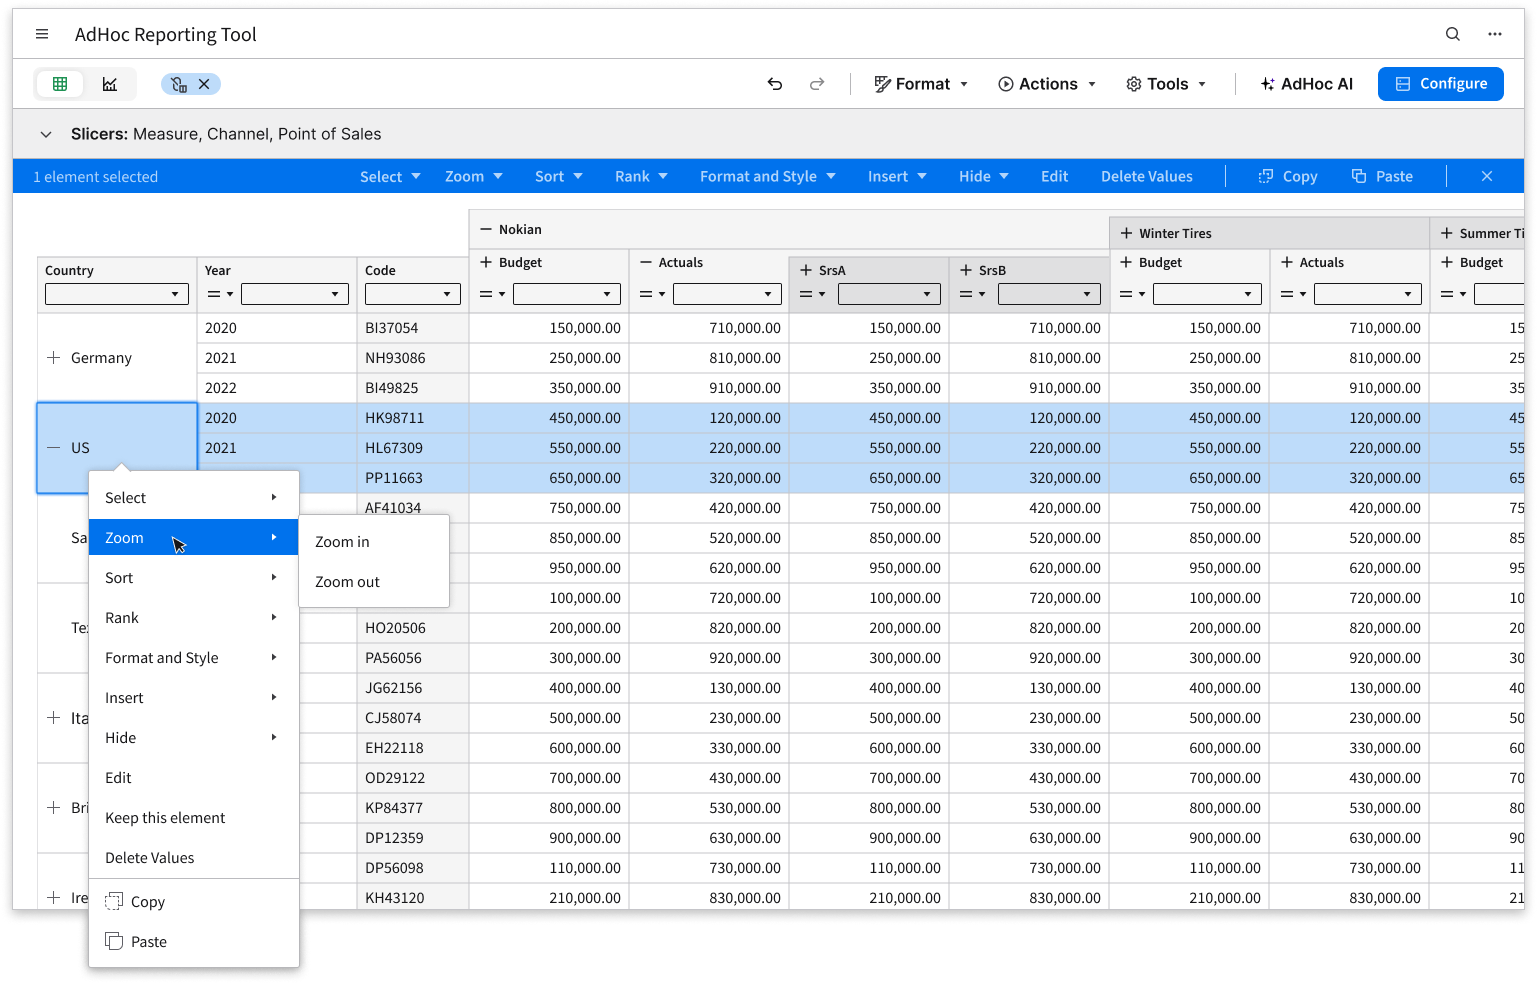
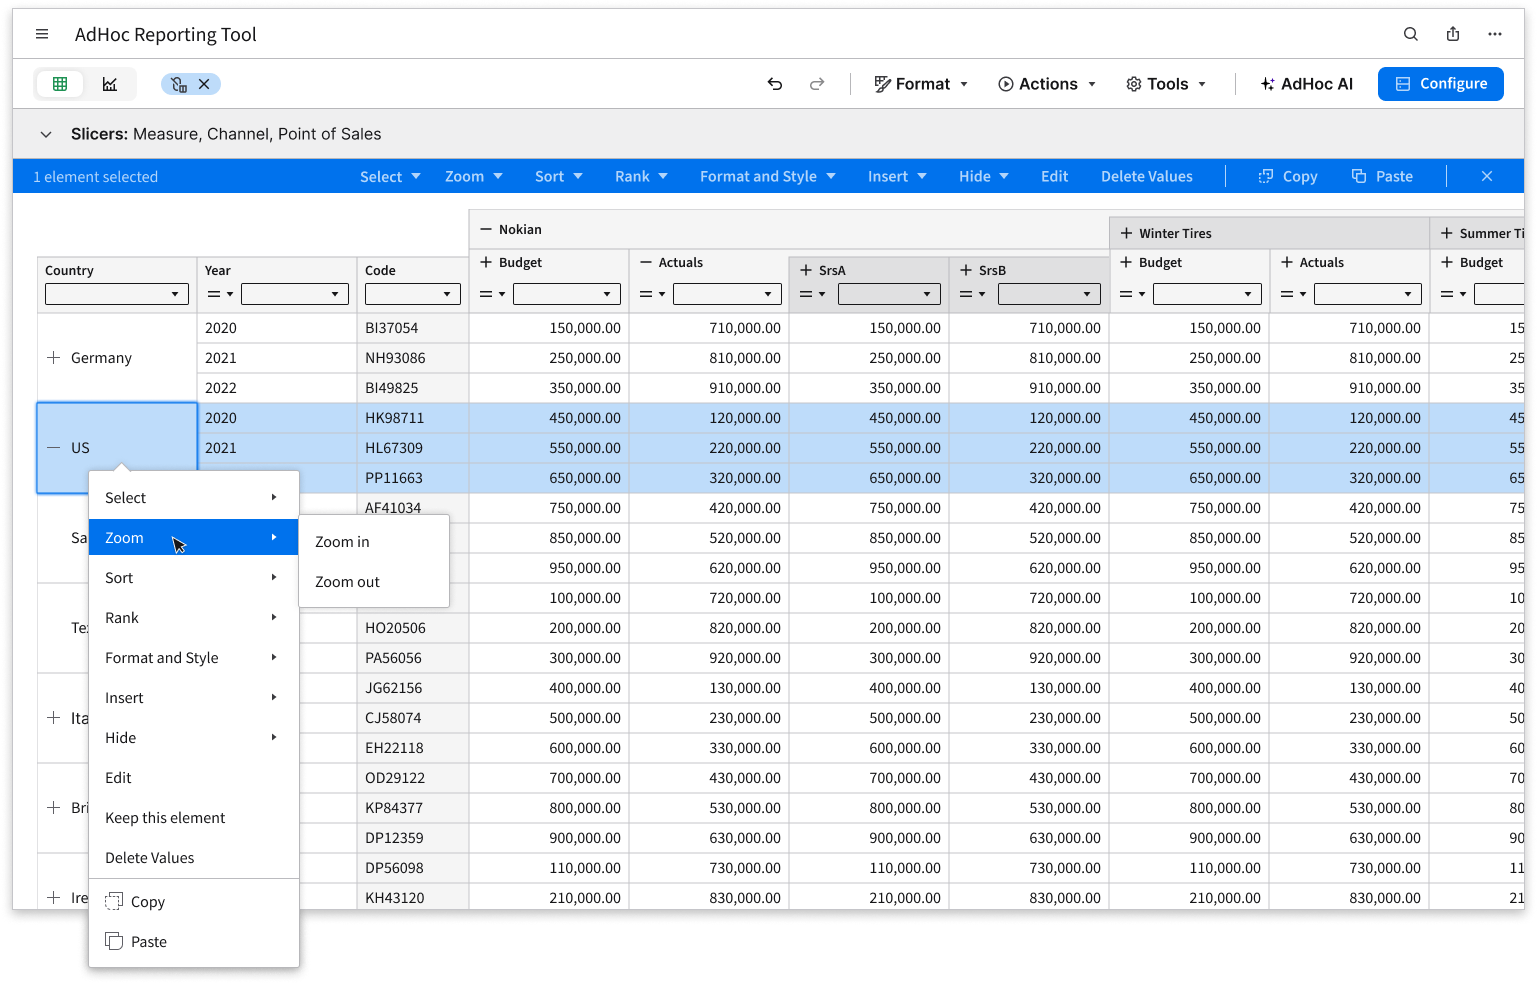
Designing the Advanced Grid
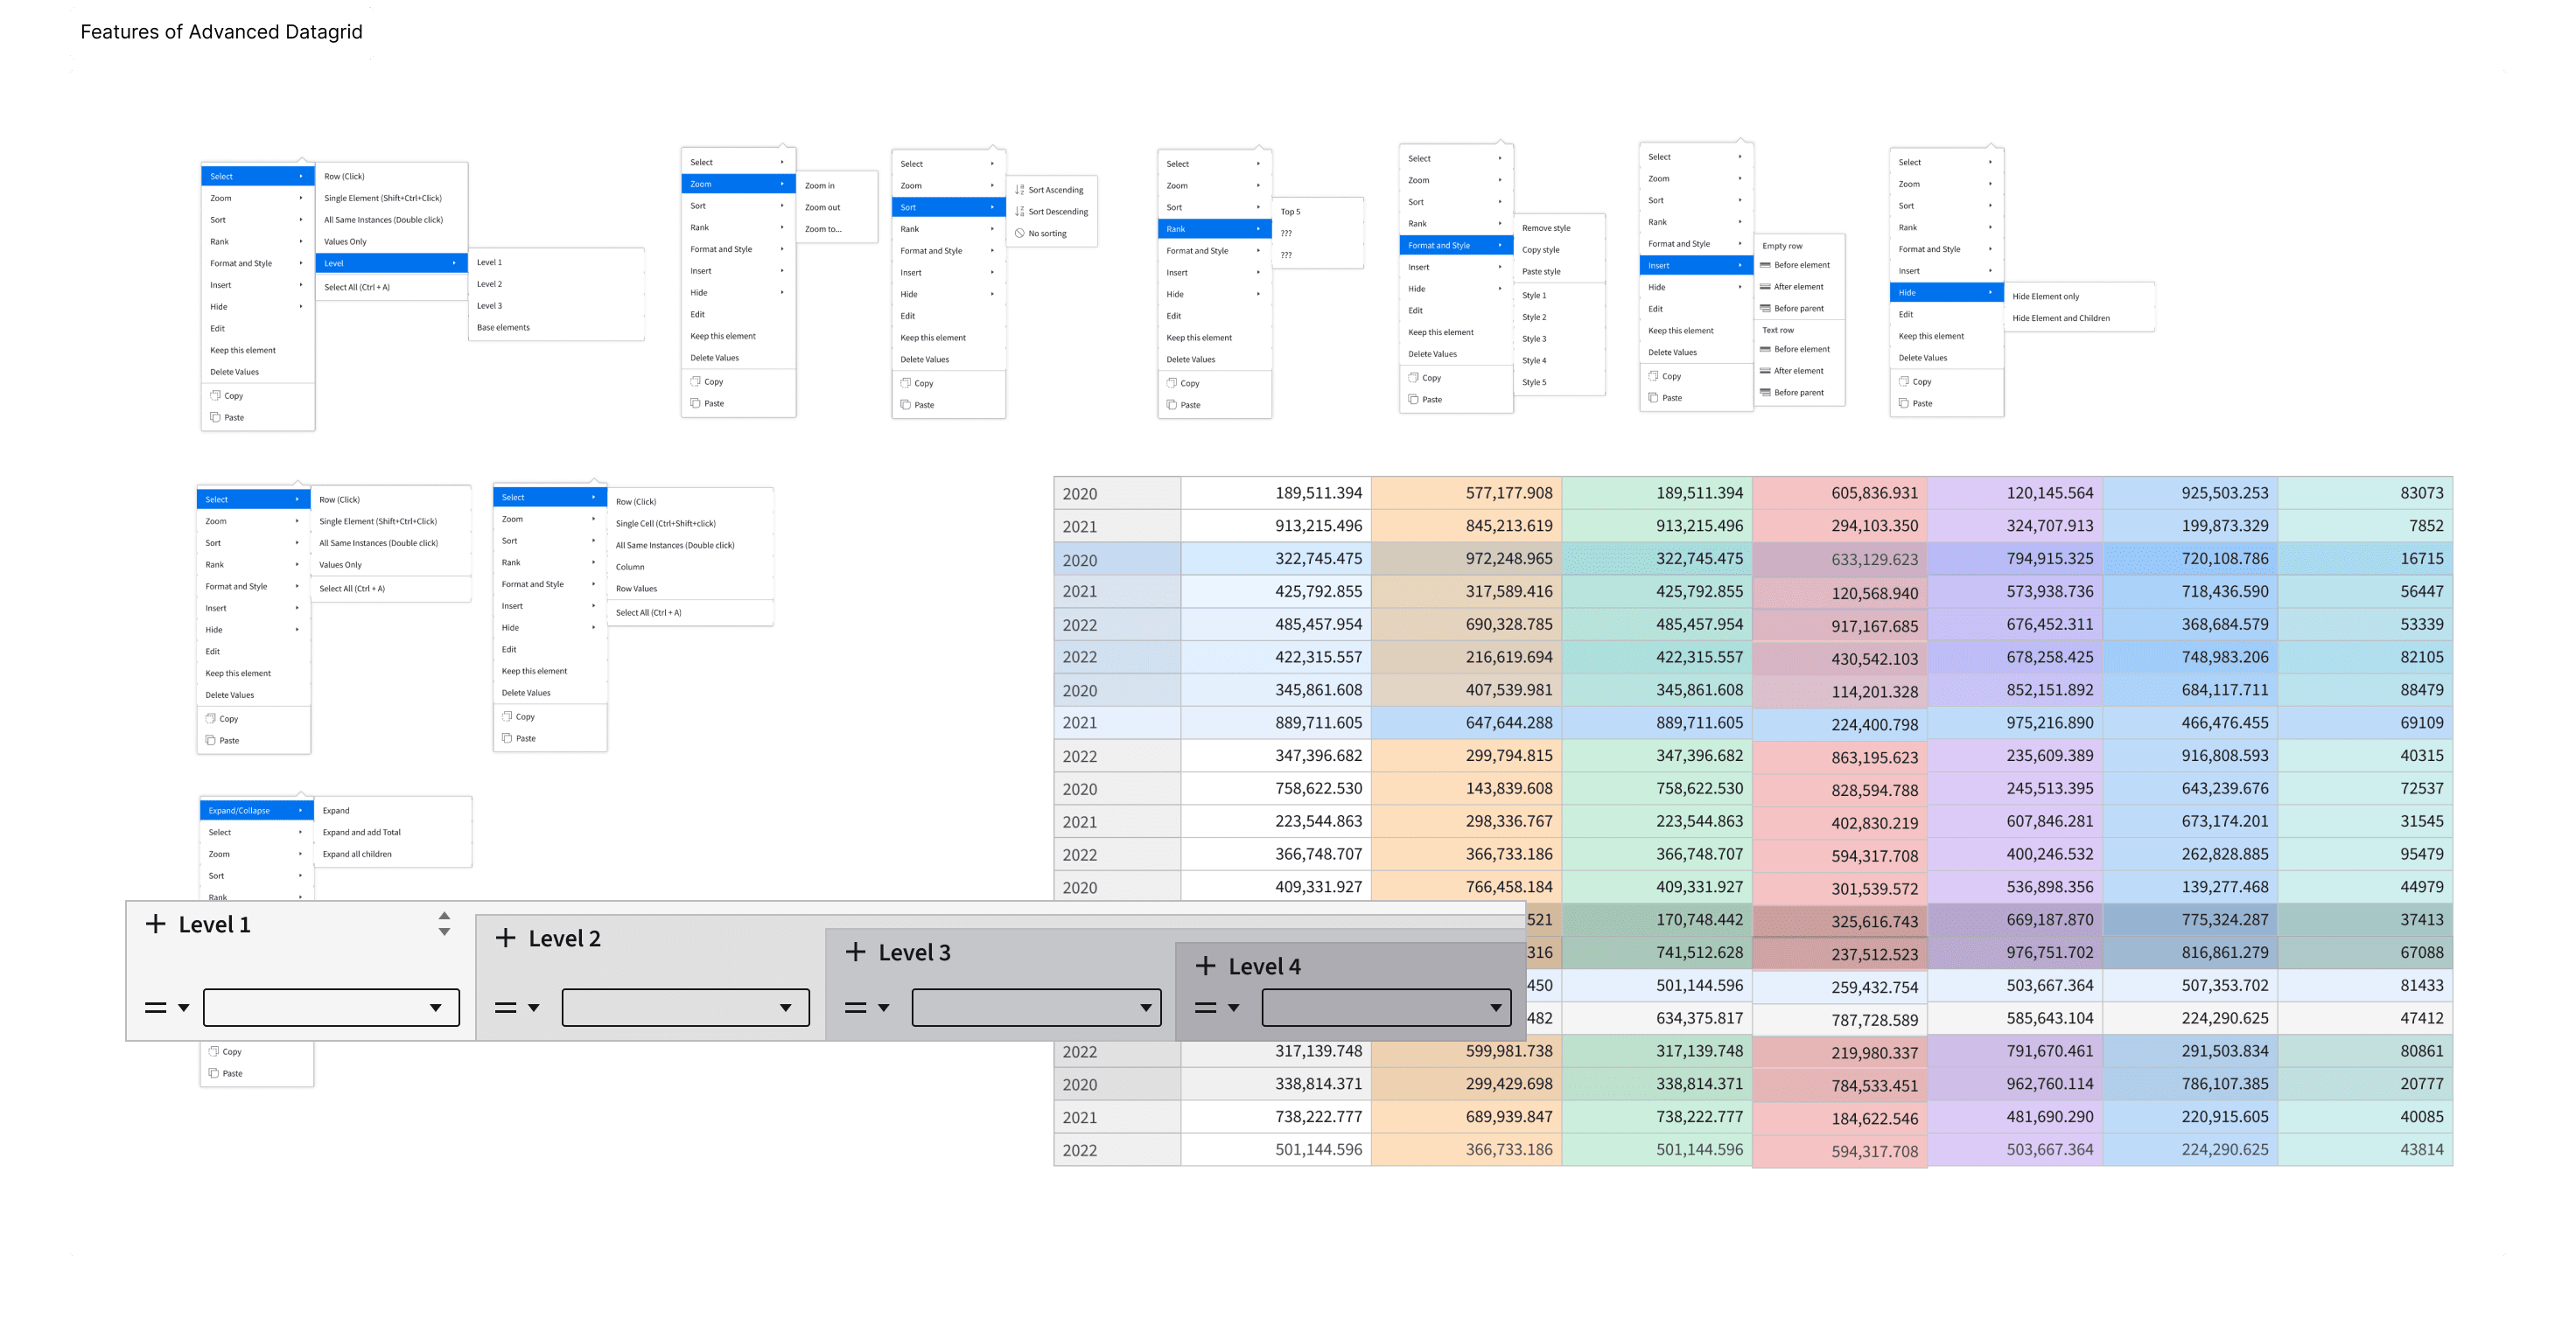
The centerpiece of the product was the Advanced Grid.
Traditional tables were not sufficient for multidimensional financial analysis. Users needed to understand where numbers originated, navigate across hierarchies, compare dimensions, and explore relationships between different parts of the data model.
I designed a new grid experience that allowed users to:
- expand and collapse hierarchical headers
- drill into data
- swap axes
- sort and rank values
- filter results
- inspect data origins
- select data in multiple directions
- quickly return to the original state
The goal was to transform the grid from a passive reporting surface into an active exploration tool.
For advanced users, many interactions could also be performed through keyboard shortcuts, allowing faster navigation across large datasets.
Making Financial Reports Easier to Read
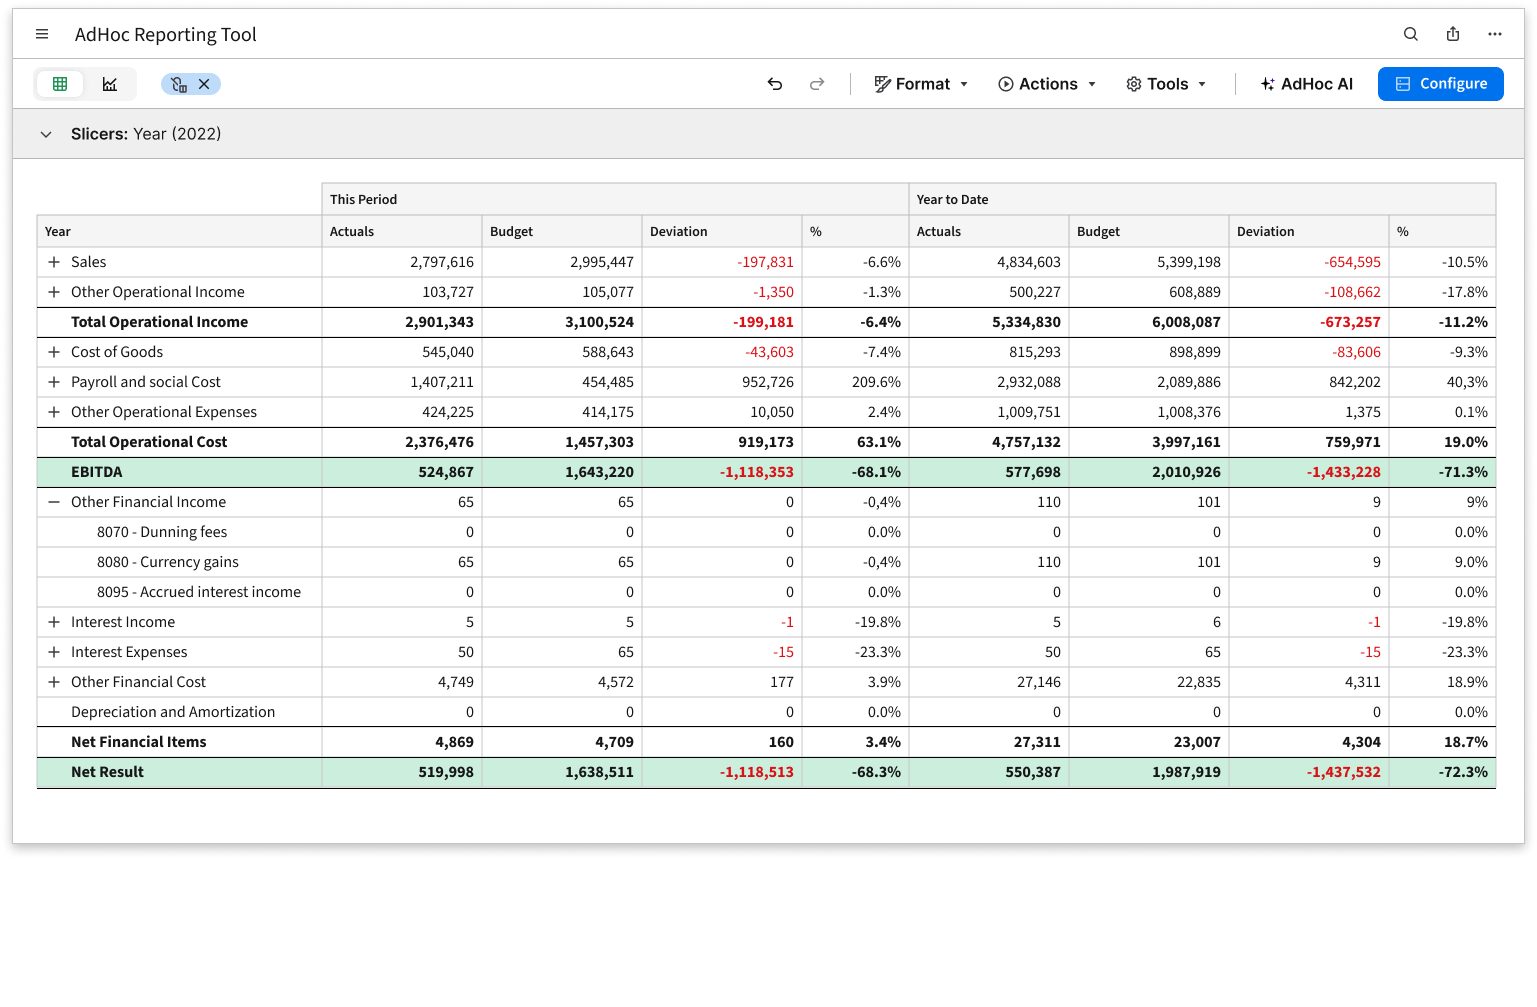
Financial reports often rely on visual conventions that users recognize instantly: totals, subtotals, underlines, highlights, and exceptions.
I designed a rule-based styling system that allowed users to define formatting once and automatically apply it across dynamic reports.
Instead of manually styling individual cells, users could create reusable rules for:
- totals and subtotals
- important data points
- exception values
- financial reporting conventions
- custom formatting logic
Because reports continuously changed as data evolved, rule-based styling helped maintain consistency while dramatically reducing manual effort.
Connecting Data and Visualization
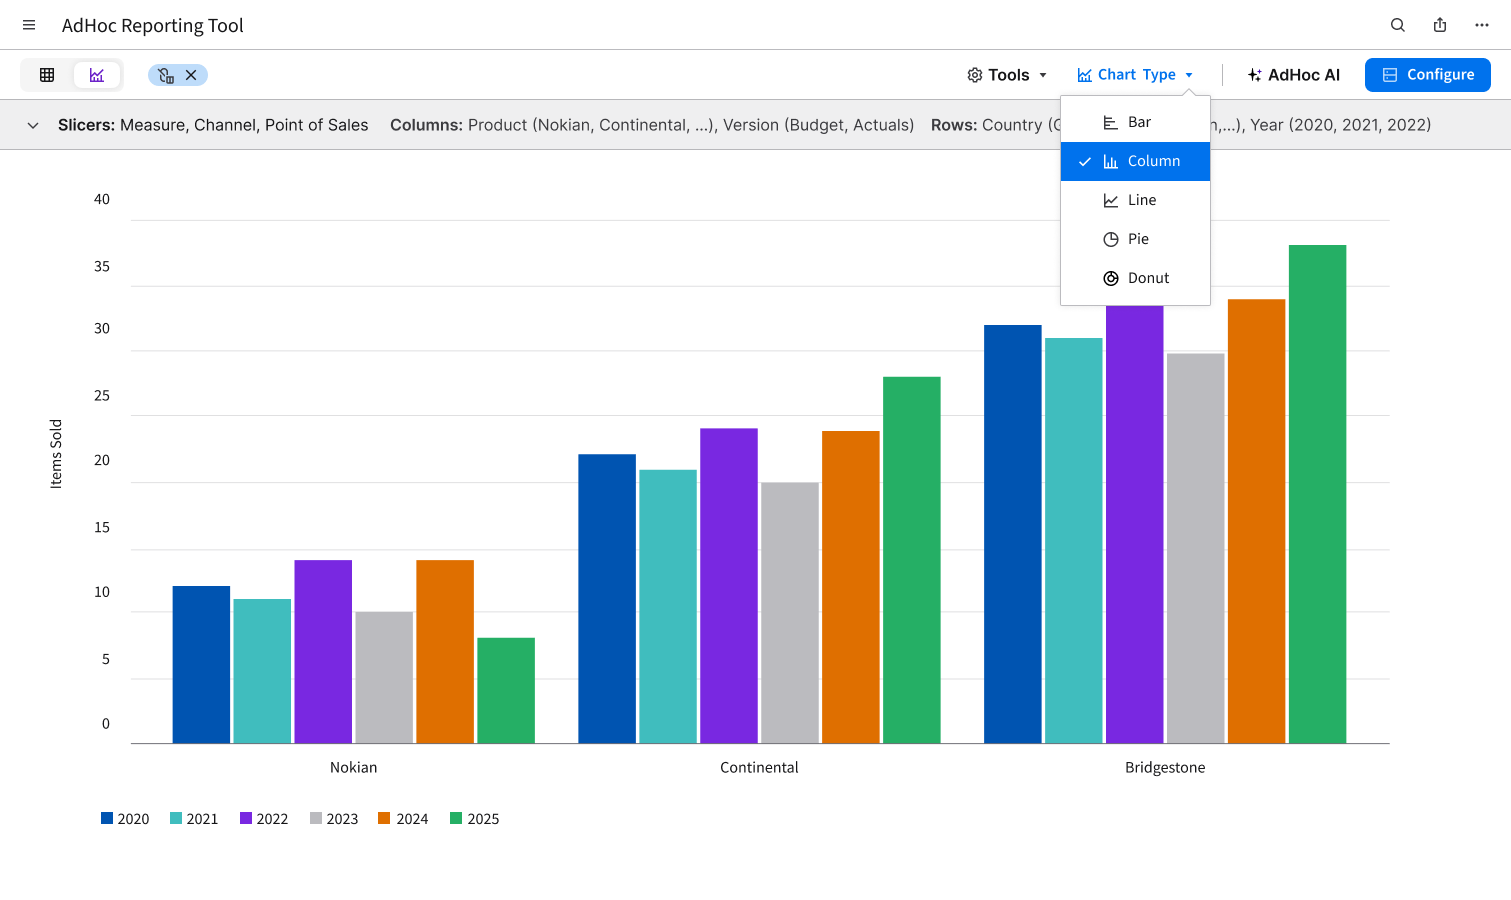
Charts were designed as an extension of the reporting experience rather than a separate feature.
Users could move between tabular and visual representations of the same data while maintaining context and preserving their analytical workflow.
This allowed users to identify trends, compare values, and explore large datasets more effectively without constantly rebuilding reports or switching tools.
The ability to save reports and visualizations as dashboard components further expanded how analytical insights could be shared across teams.
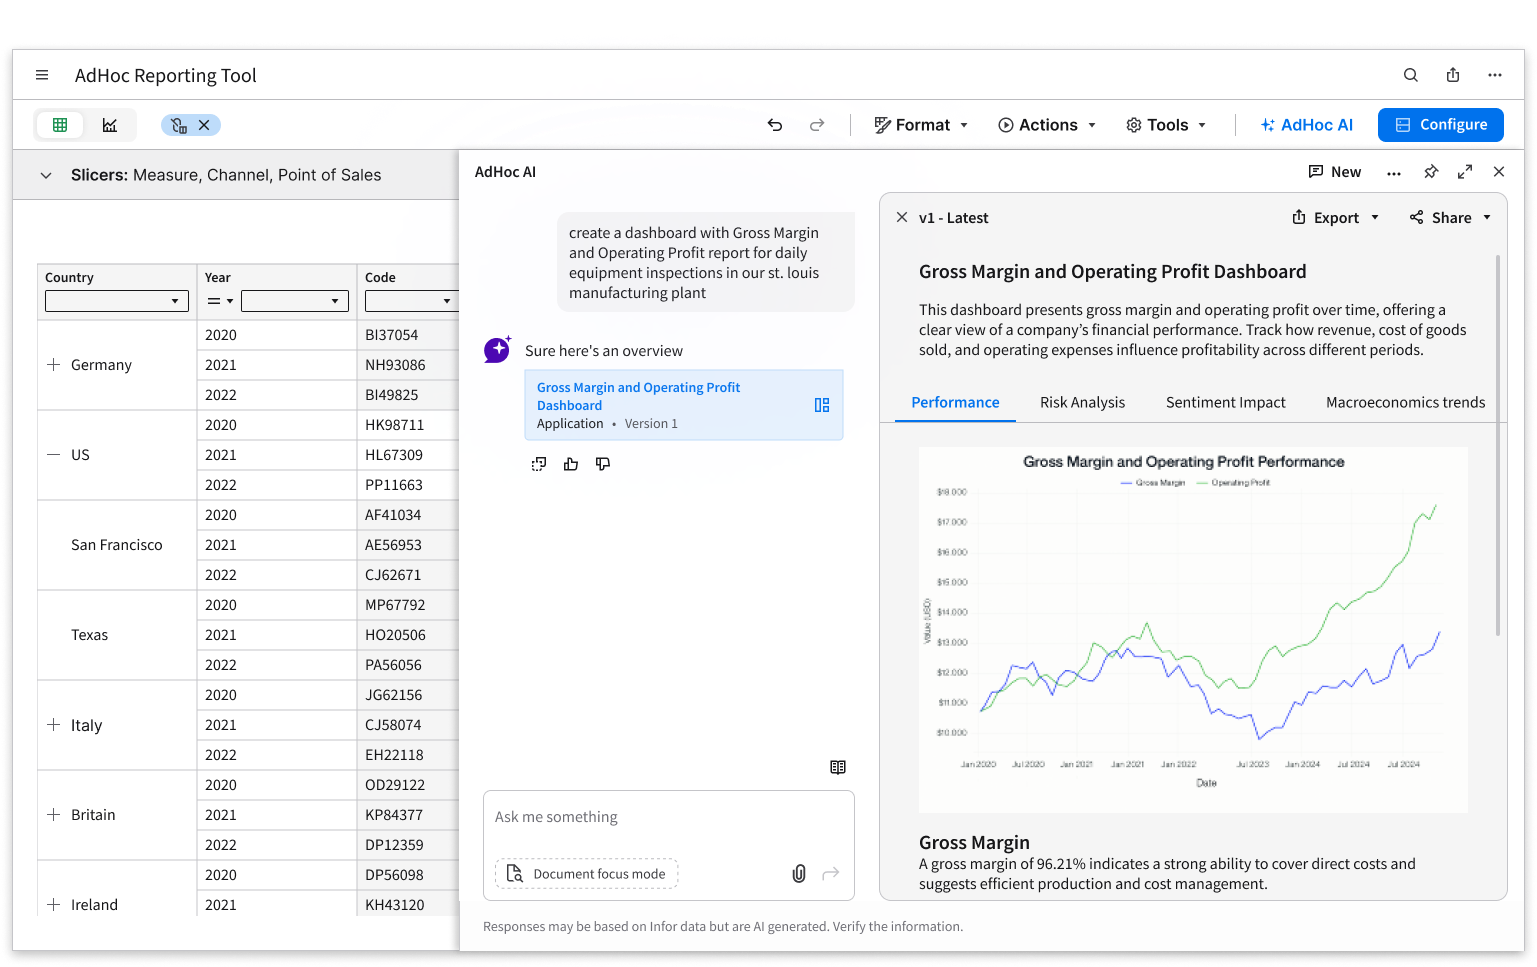
Evolving Toward AI-Assisted Analytics
The most recent evolution of the product introduced AI-assisted reporting and analytics.
Traditionally, users interacted with reports through grids, filters, dimensions, and visualizations. While powerful, these workflows still required users to understand the structure of the underlying data.
Working closely with developers, I helped define how AI could become a new entry point into the system.
Instead of manually building reports, users could ask questions such as:
"What was my revenue in EMEA last year?"
and immediately receive either a direct answer or a generated report containing the relevant data.
A key design challenge was balancing simplicity with transparency. Users needed the speed of natural language interactions while still maintaining visibility into how results were generated and the ability to refine, validate, and expand the analysis.
Rather than replacing traditional analytical workflows, AI became an additional layer that helped users access complex data faster and with less effort.
Impact
Infor AdHoc successfully transformed reporting from a static consumption experience into an interactive analytical environment.
The Advanced Grid gave users direct access to multidimensional data, while rule-based styling, chart integration, and dashboard capabilities made reports easier to build, maintain, and share.
The success of the grid architecture and report configuration workflows led to their adoption as foundational building blocks for additional reporting and dashboard products within the Infor EPM ecosystem.
By combining familiar workflows with powerful exploration capabilities, the product helped make complex financial data more accessible, actionable, and easier to understand.